# Downside Tail Ratio: Understanding and Implementing Tail Risk Hedging
## Introduction
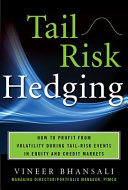
In the world of finance and investment, understanding and managing risk is paramount. Traditional measures of risk, such as variance and volatility, provide useful information but often fall short in capturing the extreme moves in the market, known as tail events. To address this limitation, financial engineers and risk managers have developed more sophisticated tools to measure and manage tail risk. One such tool is the Downside Tail Ratio (DTR), introduced by Vineer Bhansali in his book "Tail Risk Hedging."
[](https://www.investopedia.com/thmb/EmYaUIvKu6ZoJORUu3U0vFnRhAE=/1500x0/filters:no_upscale%28%29:max_bytes%28150000%29:strip_icc%28%29/Clipboard01-5c684fb046e0fb0001f0e38b.jpg)
*Illustration of Tail Events in Finance*
At its core, DTR is a measure of tail risk that combines the concepts of Value at Risk (VaR) and reward-to-risk ratios. By focusing on the adverse outcomes of an investment, DTR offers a more comprehensive understanding of risk exposure and enables investors to make more informed decisions.
## Core Concepts and Calculation
DTR is calculated as the ratio of the expected return of a portfolio or strategy to the VaR of that same portfolio or strategy. The VaR is a measure of the maximum loss over a specific time horizon at a given confidence level. By dividing the expected return by the VaR, DTR provides a measure of the potential return per unit of risk in the tail region.
[](https://www.investopedia.com/thmb/SRlVuwK046h_HutpaR0Pbqxs-Ys=/1500x0/filters:no_upscale%28%29:max_bytes%28150000%29:strip_icc%28%29/Variance-CovarianceMethod5-5bde86ce7819405ca63f26aa275a4bd2.png)
*Graphical Representation of Value at Risk \(VaR\)*
Mathematically, DTR is represented as:
DTR = (Expected Return) / VaR
In practical terms, DTR offers several advantages over traditional risk measures:
[](https://i.ytimg.com/vi/uzzHW47fh_w/maxresdefault.jpg)
*Understanding Reward-to-Risk Ratios*
1. **Tail Focus**: DTR specifically focuses on the adverse outcomes of an investment, providing a more comprehensive view of risk.
2. **Reward-to-Risk Framework**: By incorporating the expected return in its calculation, DTR allows investors to assess the potential compensation for the assumed risk.
3. **Flexibility**: DTR can be calculated over different time horizons and confidence levels, making it suitable for various investment strategies and risk management scenarios.
## Practical Implications and Examples
To better understand the practical implications of DTR, let's consider two examples:
### Example 1: Hedging a Stock Portfolio
Suppose an investor holds a stock portfolio with an expected return of 8% and a 95% one-year VaR of 15%. In this case, the DTR is calculated as:
DTR = 8% / 15% = 0.53
This result suggests that the investor receives a return of 0.53% for each percentage point of VaR they are willing to accept. In other words, the investor is expected to earn $0.53 for every $1 of potential loss they are willing to assume.
[](https://www.investopedia.com/thmb/EzEPTEjUN0he7bGyrP26y9wNtjY=/1500x0/filters:no_upscale%28%29:max_bytes%28150000%29:strip_icc%28%29/deltahedging.asp-final-0f7419fd8d574f35a8db99c1339fec37.png)
*Example of Hedging a Stock Portfolio*
### Example 2: Comparing Investment Strategies
Let's consider two investment strategies:
* Strategy A has an expected return of 10% and a 95% one-year VaR of 12%.
* Strategy B has an expected return of 12% and a 95% one-year VaR of 15%.
Calculating the DTR for both strategies yields:
* Strategy A: DTR = 10% / 12% = 0.83
* Strategy B: DTR = 12% / 15% = 0.80
These results indicate that, while Strategy B offers a higher expected return, its DTR is lower than that of Strategy A. As a result, an investor may prefer Strategy A despite its lower expected return, as it provides a higher reward-to-risk ratio in the tail region.
[](https://www.slideteam.net/media/catalog/product/cache/1280x720/p/r/property_investment_strategies_comparison_matrix_slide01.jpg)
*Comparing Investment Strategies with DTR*
## Conclusion
In conclusion, DTR is a valuable tool for understanding and managing tail risk in investment portfolios and strategies. By focusing on the adverse outcomes and incorporating the expected return in its calculation, DTR offers investors a more comprehensive measure of risk that enables better decision-making.
To further explore the topic of tail risk hedging and the Downside Tail Ratio, consider the following avenues:
1. **Advanced Tail Risk Measures**: Investigate other advanced tail risk measures, such as Conditional Value at Risk (CVaR) and Expected Shortfall (ES).
2. **Tail Risk Hedging Strategies**: Study various tail risk hedging strategies, including options, futures, and other derivatives.
3. **Portfolio Optimization with Tail Risk Measures**: Delve into the application of tail risk measures in portfolio optimization, asset allocation, and risk management.
4. **Empirical Analysis**: Perform empirical analyses of tail risk measures and their effectiveness in different markets and asset classes.
5. **Case Studies**: Analyze real-world case studies of tail risk events and management approaches to better understand the practical implications of tail risk measures.
Last updated: 2024-05-06
Related Books
Related Knowledges