# Quantile Regression: An In-depth Look at a Robust Statistical Technique
## Introduction
Quantile regression (QR) is a statistical method used to analyze the relationship between a response variable and one or more explanatory variables. This technique generalizes the traditional least squares regression by modeling various quantiles of the response variable instead of just the conditional mean. Consequently, QR offers a more comprehensive view of the relationship between the variables and provides valuable insights into the distribution of the response variable.
In the context of risk management, tail risk hedging, and finance, QR plays a critical role in understanding extreme events and their impact on a portfolio. This technique, when applied appropriately, can offer actionable insights for risk mitigation and better decision-making. This article delves into the core concepts of quantile regression, its relevance, and practical implications through diverse examples and applications.
[](https://www.aptech.com/wp-content/uploads/2019/01/gblog_quantreg_basics_2019.png)
*Quantile Regression Process*
## Quantile Regression: Core Concepts
Consider a dataset with a response variable, $Y$, and a set of $p$ explanatory variables, $X = [X\_1, X\_2, \ldots, X\_p]$. In QR, the primary objective is to estimate the value of $Y$ at a given quantile, $\tau$, as a function of these explanatory variables. We can express this mathematically as:
$$
Q_{Y|X}(\tau) = X\beta_{\tau},\quad\quad 0 < \tau < 1
$$
Here, $\beta_{\tau}$ denotes the parameter vector at quantile $\tau$. This can be estimated by solving the following optimization problem:
$$
\min\limits_{\beta} \sum_{i = 1}^{n} \rho_{\tau}(y\_i - X\_i\beta)
$$
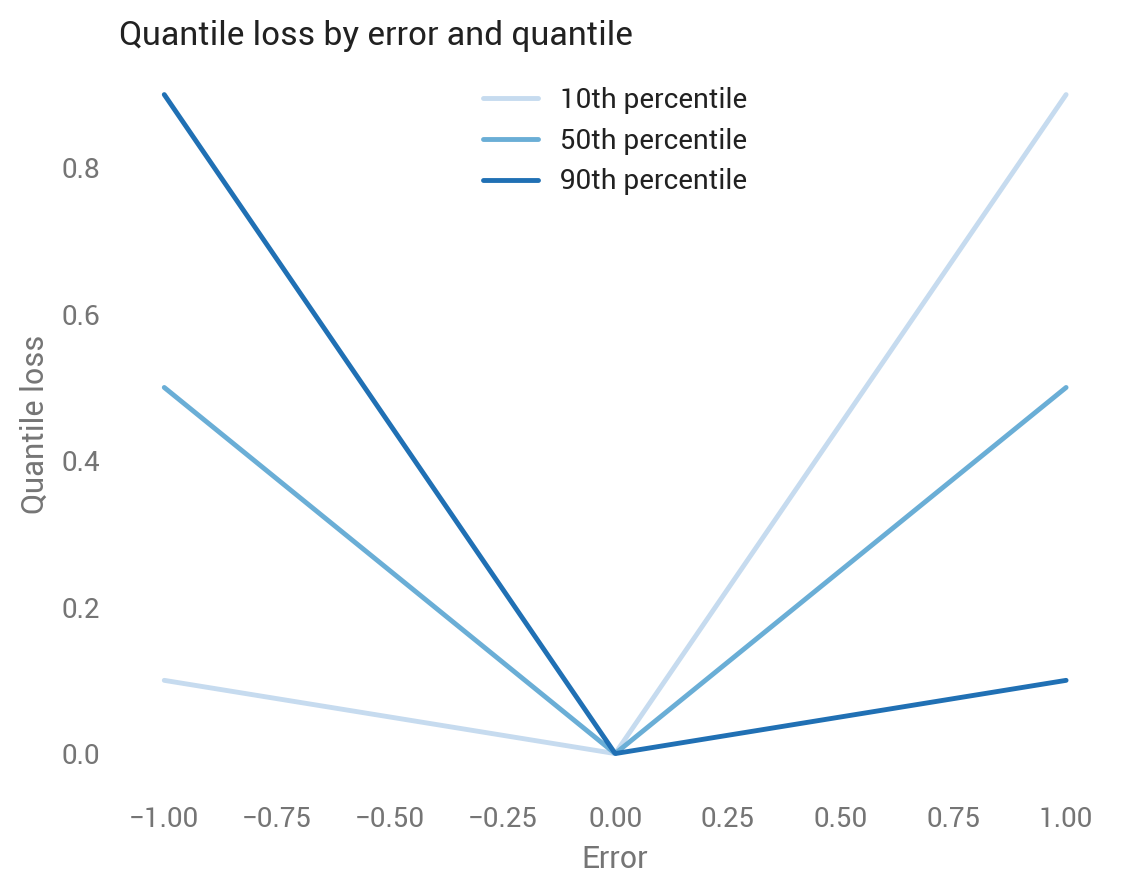
where $\rho_{\tau}(u) = u(\tau - I(u<0))$ is the quantile loss function, and $I(\cdot)$ is the indicator function.
[](https://miro.medium.com/v2/resize:fit:1358/0*ufWnnvTA9AkjKrfI)
*Quantile Loss Function*
## Relevance of Quantile Regression
In various fields, including finance and economics, it is crucial to model the entire conditional distribution of a response variable rather than just the conditional mean. A key advantage of QR over traditional least squares regression is its ability to account for heteroscedasticity and provide robust estimates of conditional quantiles.
Moreover, QR excels at modeling asymmetric and nonlinear relationships between variables, even in the presence of outliers. Such features make QR a valuable tool in tail risk hedging, as it can capture and analyze extreme events and tail behaviors that might be missed using conventional methods.
## Practical Implications: Examples and Applications
### 1. Understanding Credit Risk with Quantile Regression
Credit risk modeling is a crucial aspect of the financial industry, where understanding and quantifying extreme events plays a significant role in determining a bank's solvency and financial stability.
Suppose a dataset containing information about credit applicants' socio-demographic (age, income, etc.) and financial (loan amounts, existing debts, etc.) characteristics is available. QR can be employed to model the probability of default (PD) for credit applicants — a fundamental element of any credit risk model. By applying QR, banks can estimate the conditional quantiles of PD at different levels and gain insights into the tail behavior of the credit risk.
For instance, QR can uncover if low-income applicants are more prone to high PD and how this relationship changes at different quantiles. Additionally, by evaluating the effect of financial factors such as loan amount and existing debts, banks can optimize their risk-based pricing strategy.
[](https://i1.rgstatic.net/publication/344154079_Analyzing_How_Credit_Risk_Influences_the_Performance_of_Commercial_Banks_in_Bangladesh_A_Quantile_Regression_Modeling/links/5f561b6c458515e96d35f752/largepreview.png)
*Credit Risk Model using Quantile Regression*
### 2. Analyzing Stock Market Tail Risk with Quantile Regression
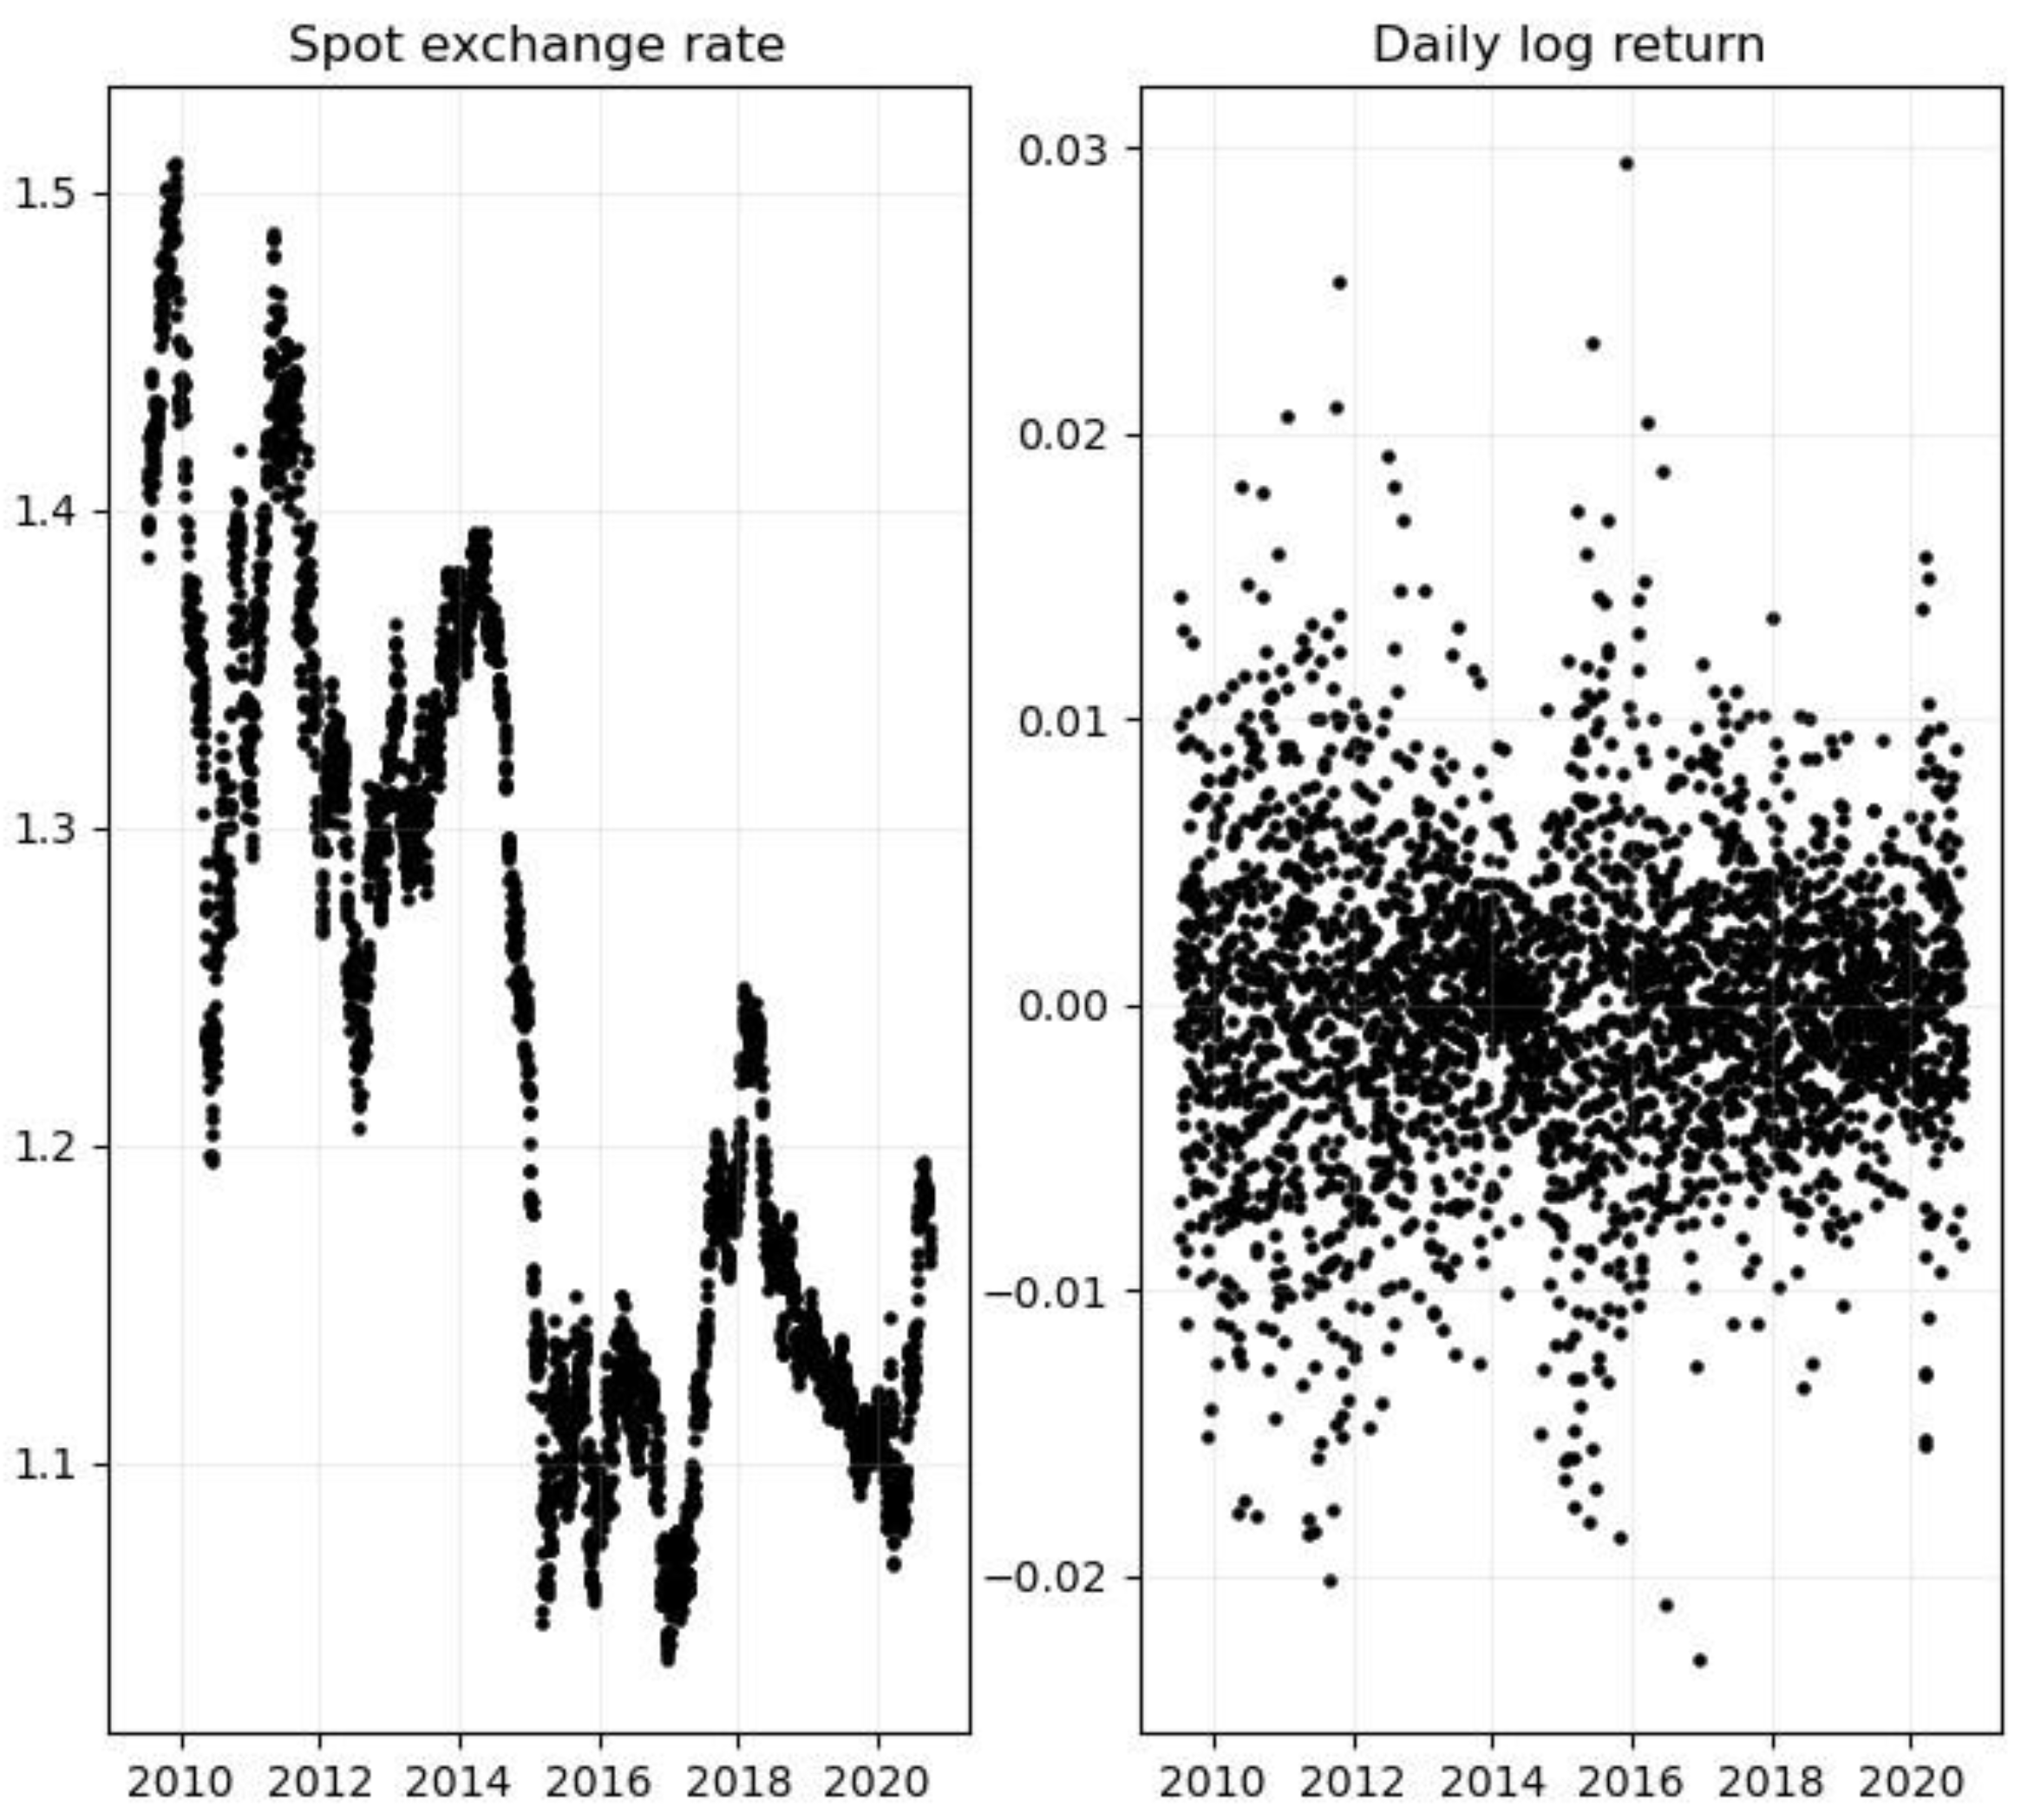
Tail risk management in stock portfolios is a crucial task for institutional and individual investors. QR can provide valuable insights into the relationships between stock returns, macroeconomic factors, and tail events.
Consider a dataset with daily returns from a set of stocks and various macroeconomic variables, such as inflation or unemployment. QR can be applied to model the lower quantiles of stock returns as a function of these macroeconomic factors. This, in turn, enables investors to assess the influence of these factors on the downside risk of the stocks and design optimal risk management strategies.
For example, QR analysis might reveal that stock $A$ exhibits greater left-tail risk sensitivity to increasing inflation compared to stock $B$. Consequently, investors can allocate their portfolio accordingly or consider derivative-based hedging strategies to mitigate the identified tail risk.
[](https://pub.mdpi-res.com/jrfm/jrfm-16-00312/article_deploy/html/images/jrfm-16-00312-g001.png?1687938496)
*Stock Market Tail Risk Analysis*
## Conclusion
Quantile regression is a powerful tool for analyzing complex relationships in various fields, including finance, economics, and risk management. By accounting for heteroscedasticity, robustly estimating conditional quantiles, and modeling asymmetric and nonlinear relationships between variables, QR provides valuable insights into the distribution of response variables, especially concerning tail behaviors.
Investigating the credit risk of prospective borrowers and managing stock market tail risk are just two examples where QR has significant practical implications. For further exploration of this topic, consider researching the following topics:
1. Asymmetric relationships and quantile regression
2. Quantile regression in time series analysis
3. Quantile regression vs. expectile regression
4. Bayesian quantile regression
5. Nonparametric quantile regression
Confidence: 85%
Last updated: 2024-04-18
Related Books

Related Knowledges